 " id="k8-modal-content" alt="modal">
Customer chartjs
Goal
Develope a chartjs graph.
The basic customer table already exist. The numerical columns of your database table are automatically associated to your graph columns.
More informations:
- K8 Web Kit chartjs
- chartjs.org
Support is available by discord: K8 Web Kit
Prerequisites
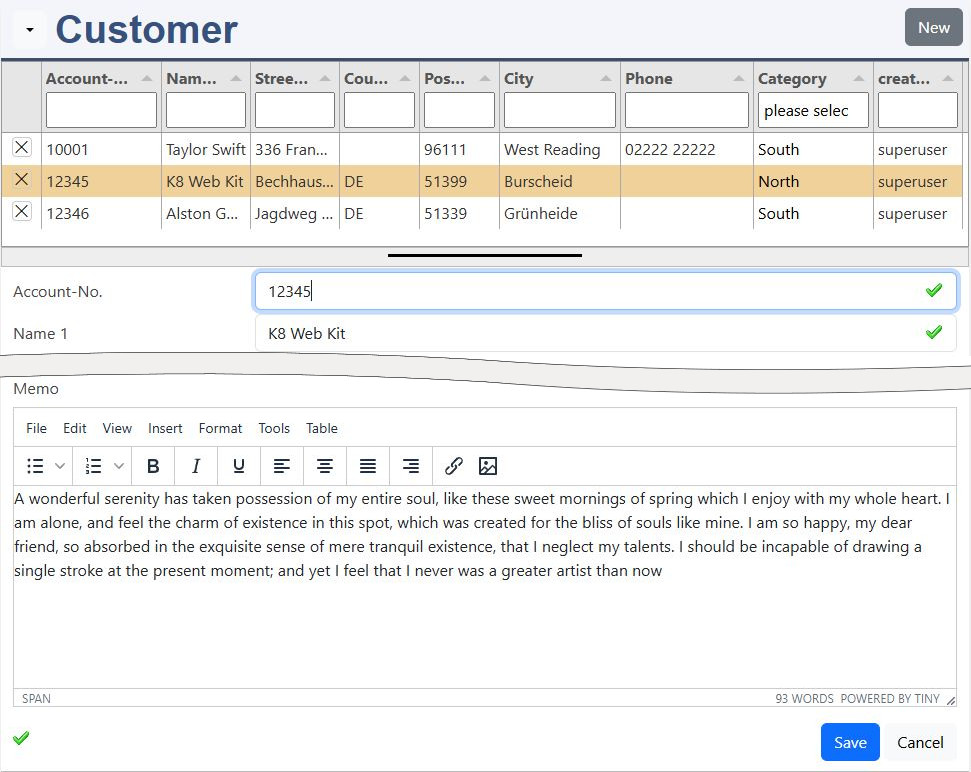
Your customer element from the first exercise:
- customer table with the columns:
- headtitlecolumn: name1
- estimatedturnover
- estimatedcosts
Instructions for Elements online
data defintion: excustomer.json:
Please have a look to the documentation of elements online.
You need to be registerted and logged in. Open the elements online in your environement.
Choose your datadefID from the first exercise. Edit the data defintion (excustomer.json). Add the chartjs library in the head[].
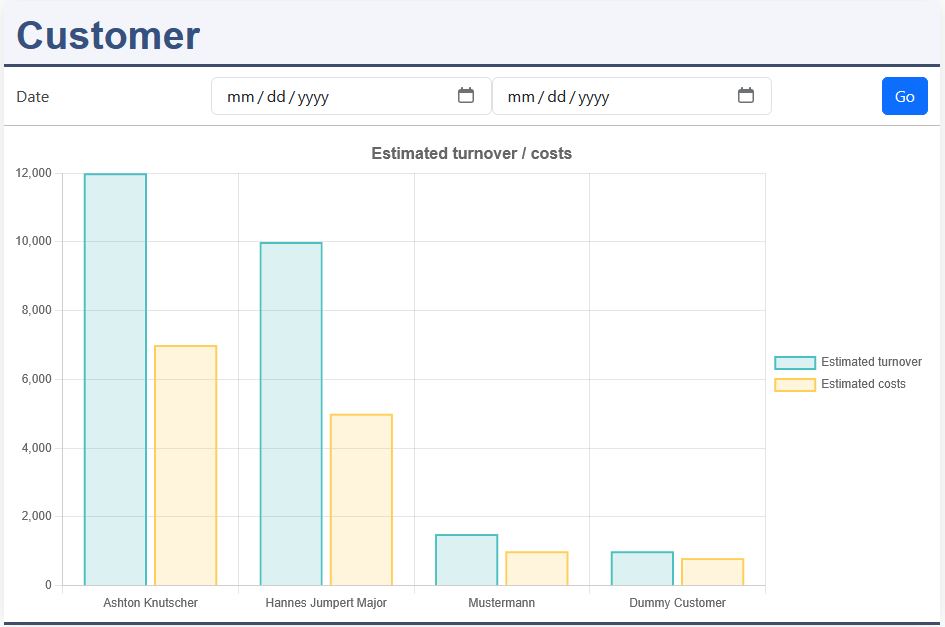
First chartjs, basic settings
Without defining your columns, K8 Web Kit creates a bar chart about the numerical columns of your database table.
basic settings:
Please insert this data structure into your datadefinition, the "JSON" file.
With the settings for title and legend they are formatted and positioned. More at:
The supported chart types are:
- bar (default)
- line
- pie
- doughnut
Define the columns
For the 2 columns:
- estimatedturnover
- estimatedcosts
the bar color is changed and the label for the legend ist set.
Create a filter form
The defintion for the filterform: filterobject is placed in the section:
- chartjs_def
One field
With figure is set to "2", which allows to enter a range. The operator is set to ">=". The operator for the max field is set automatically.
Save
Attention, it's not saved by a red box at the window bottom line! Only by the green "saved" message, you can continue.
Edit data by bar click (JavaScript for programmers)
excustomer.js:
Insert this lines behind the function declaration.
Save
Explanation
Chart.js offers a onClick event and also alows to change the dataset and update it. Attention, this is a subject for programmers and chart.js experts.
- add chartjs.options.onClick()
- get the index of clicked bar
- config settingsexcustomer.masterdata for edit:
- keyvalue: the accountID of the customer record
- edittype / window_mode set to 3 for editing in overlay
- notabulator / bnofrom to disable the tabulator list
- config settingsexcustomer.return for execution after save:
- set chartsjs
- set data_index
- masterdata: open the master data form
Call back: cbafterSave() updates the chart:
chart.data.datasets[0]- options.settings.return contains:
- chart: the chart element
- data_index: index of the chart dataset
- chart.data.datasets[]data[index] are updated with the customer record
- chart.update(), the chart is displayed with the new data