 " id="k8-modal-content" alt="modal">
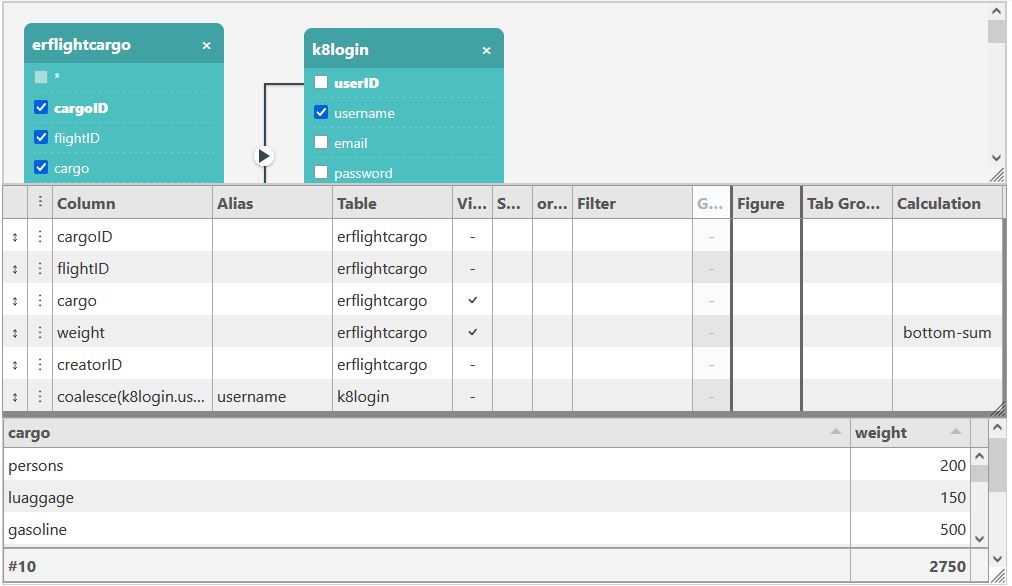
Create complex SQL queries visually. Add tables, connect them with joins, select the required columns and define filters, grouping and calculations.
The graphical approach makes relationships between tables and the resulting data structure easier to understand. Tables and fields can be connected directly in the workspace, without having to write the complete SQL statement manually.
The resulting query can be used directly as a data source for K8 Web Kit elements such as lists, forms, catalogs and charts. This makes it possible to combine data from different tables and turn it into a usable web application component.
Introduction
The sql assistant allows you to add tables to your datadefinition. Join them to your main table and choose the columns.
Attention, don't remove columns, which are important for the form assistant.
Attention: <table>.*
This expression stand for all columens of the table. There are some special rules:
- it's only available for the main table
- it always need to be visible
- other fields are not clickable
Goal
The sql assistant allows you to extend the sql statement of a datadefintion.
The areas are
- Diagramor table area
- SQL-Columns area
- Result area
Tabulator list
The tabulator list is created by the columns of the sql statement. It is displayed in the result area.
New columns can be added. They can be adopted in the "JSON" configuration. Old columns keep the configuration.
In the right bottom corner you can enlarge the area
Diagram Area
Add table
With the button "Add table" in the headline a popup appears. There you choose the table, give an alias name and add it to the diagram.
Position the table
Drap & drop in the headline allows you to position the box.
Join table columns
By drap & drop you can join the column from source table to target table column.
Context menu connection of connection line
- cut connection
- select the join type
- Inner Join
- Left Outer Join (default)
- Right Outer Join
Columns
Clicking the checkbox allow you to add or remove a column.
Remove a table
With the x in the upper right corner of the table you remove the table and all columns.
functions
- add tables
- join tables
- remove tables
- columns
- add
- remove
Columns Area
Column
The column name from the chosen table, or any valid sql expression (e.g. a function call or concat_ws).
Alias
The name this column gets in the result set. This is also the key used everywhere else in this list: filter, sort, calculation and grouping all refer to a column by its alias.
Table
The table or table alias the column belongs to. Leave it empty for expressions that don't come from a single table.
Visible
The column is always part of the sql statement. Visible only controls whether it is also displayed as a column in the result/preview pane.
Sort / order
Sort sets the direction (asc/desc) this column is sorted by. If several columns are sorted, order defines the sequence they are applied in.
Filter
An optional sql condition applied to this column. It should start with an operator. Strings must be enclosed in simple apostrophes, example: ='mystring'.
Group
Marks the column for the sql GROUP BY clause, so it gets aggregated in the database query itself.
SQL Column properties
The Columns area is used to define and organize the columns of the SQL result. Existing columns can be edited, new columns can be added and columns that are no longer required can be deleted. The order of the columns can be changed easily, so the result can be structured exactly as required by the application. Each column can be configured with its own name and column alias, making database field names independent from the names displayed and used by the application. Columns can represent database fields as well as calculated or SQL-based expressions, allowing the complete result set to be built and maintained step by step:
- Add, edit and delete columns
- Move columns to change their order
- Define column names and column aliases
- Use SQL expressions for calculated columns
- Keep database field names separate from application-friendly aliases
- Build and maintain the result set without manually rewriting the complete SQL statement
Figure
This column creates a filter above the list:
- 1 stands for one field with "like" or "=" operator.
- 2 stands for 2 fields for a range with start and end value.
Filter form
The filterform is displayed at the top of each element.
Tab GroupBy
1 or 2 groups the result rows visually in the browser (Tabulator's own groupBy), independent of the sql-level Group checkbox. The number sets the grouping order.
Calculation
Column Calculation allows you to define calculated values for individual columns of the result. Calculations such as sum, average, minimum, maximum, count, unique values or concatenation are performed by Tabulator on the displayed table data rather than being added to the SQL query. Each column can define its own bottomCalc, and custom calculation functions can be used for application-specific requirements. The table-level columnCalcs property controls where the calculation rows are displayed and whether they are also shown for grouped data. Calculations are automatically updated when the table data changes:
true– show calculations at the top and bottom of the table, or in groups when grouping is enabledboth– show calculations at the top and bottom of the table and within groupstable– show calculations at the top and bottom of the table onlygroup– show calculations within groups only
A built-in Tabulator aggregate (avg, max, min, sum, concat, count, unique), prefixed with top- or bottom- to choose whether it's shown as a header or a footer row (e.g. bottom-sum, top-count).
Tabulator list
The K8 List can group records and display calculated values such as totals, averages or counts directly in the list. Tabulator provides flexible grouping and calculation options, allowing complex data to be presented as clear and structured business overviews:
- Group records by one or more fields
- Display totals and other calculations for groups or the complete list
- Use Tabulator's
groupByandcolumnCalcsfeatures
For more details, please have a look to:
Result Area
Save
With Save the sql statement is checked, stored in the datadefinition and the result area is rebuilt from it.
Filter
If one or more columns have Figure set, a filter form appears above the table. It lets you narrow down the result without changing the sql statement itself.
Column width
Drag the border between two column headers to change a column's width. Only columns you actually resize are saved with the rest of the configuration; columns you never touch keep their automatic width.
Groups
Columns marked with Tab GroupBy visually group the result rows in the table, nested by the order given (1, 2, ...). This is independent of the sql-level Group column, which aggregates rows already in the database query.
Calculations
Columns with a Calculation set show a header (top-) or footer (bottom-) row with that aggregate (avg, max, min, sum, concat, count, unique) for the whole table, and, if grouping is active, for each group as well.
Result height
Shows all Visible columns of the result. Drag the bottom-right corner to resize it; the table height follows automatically.